We have been offering our worldwide OpenStreetMap WMS for free use for several years now. What started as a game project on the first terrestris code sprint in 2011 in Mallorca as a Germany-wide WMS has since undergone some expansions, conversions and improvements. While the original service was based on UMN MapServer, the tiles have been provided by a GeoServer since 2013 with a corresponding change in the symbology. This happened at the same time as the conversion to a worldwide extension.
In addition to the technical refinement, the perception and use of the service also increased. This is particularly noticeable for terrestris when the service is exceptionally unavailable or due to hardware changes.
But who actually uses our service from where? We know some users; over the years, we have received a whole series of requests for changes, for example in the form of inquiries about the establishment of special projection systems. The most exotic request certainly came from the Hawaiian coastal protection, who kindly asked whether use for an app would also fall under free use. Other requests were more aimed at being able to use the service internally without internet access. We were also able to help here, because due to the fact that the entire software stack used is open source, it can also be installed on a virtual machine and delivered pre-cached for the customer. Or the operators of the Hamburg city portal, whom we kindly pointed out that the integrated service must be marked with the reference to the data origin from OpenStreetMap.
The recently massively increasing user numbers alone cannot explain these few known users. Good thing there is also an open source software solution for this question: Kibana. Kibana is a frontend on Elastic Search and evaluates access numbers anonymously and can visualize them on a map as a heatmap. The display can be filtered temporally, and as you zoom in, the level of detail increases.
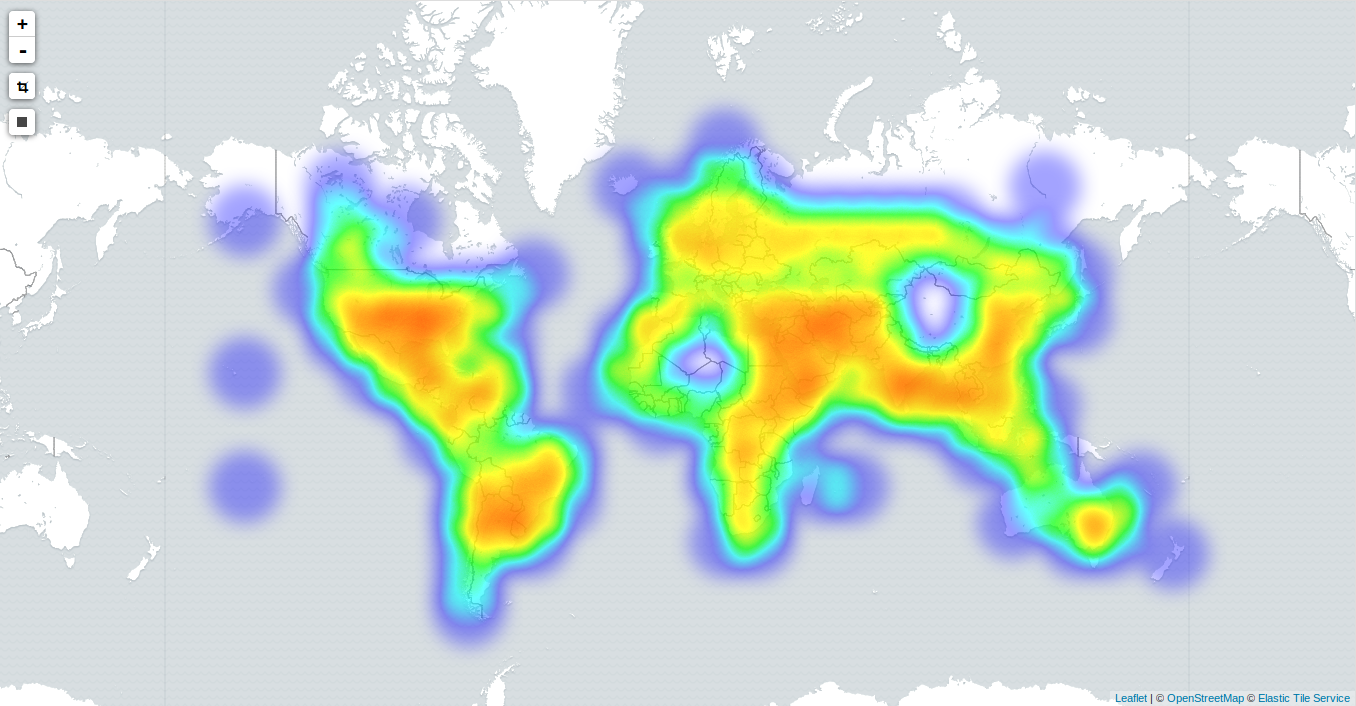
The map below shows the distribution of spatial accesses from April 5th between approximately 3 PM – 4 PM worldwide. Overall, we were able to record almost one million accesses on that day. 30 GB of data were delivered. The legend is simple: the redder, the more accesses.
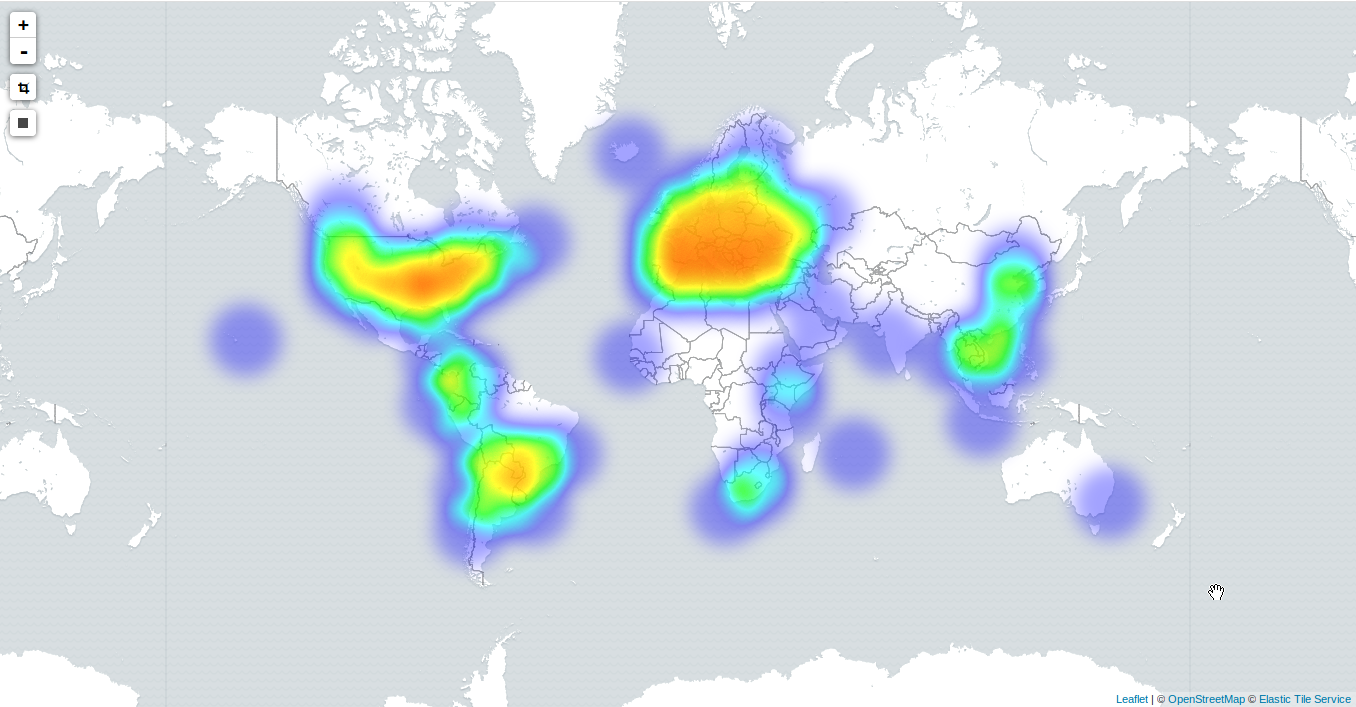
This one map alone already shows a clear access distribution: In addition to Central Europe, accesses are increasingly made from the USA, Venezuela, Brazil, South Africa, Korea and eastern China. Even a small hotspot around Hawaii can be seen.
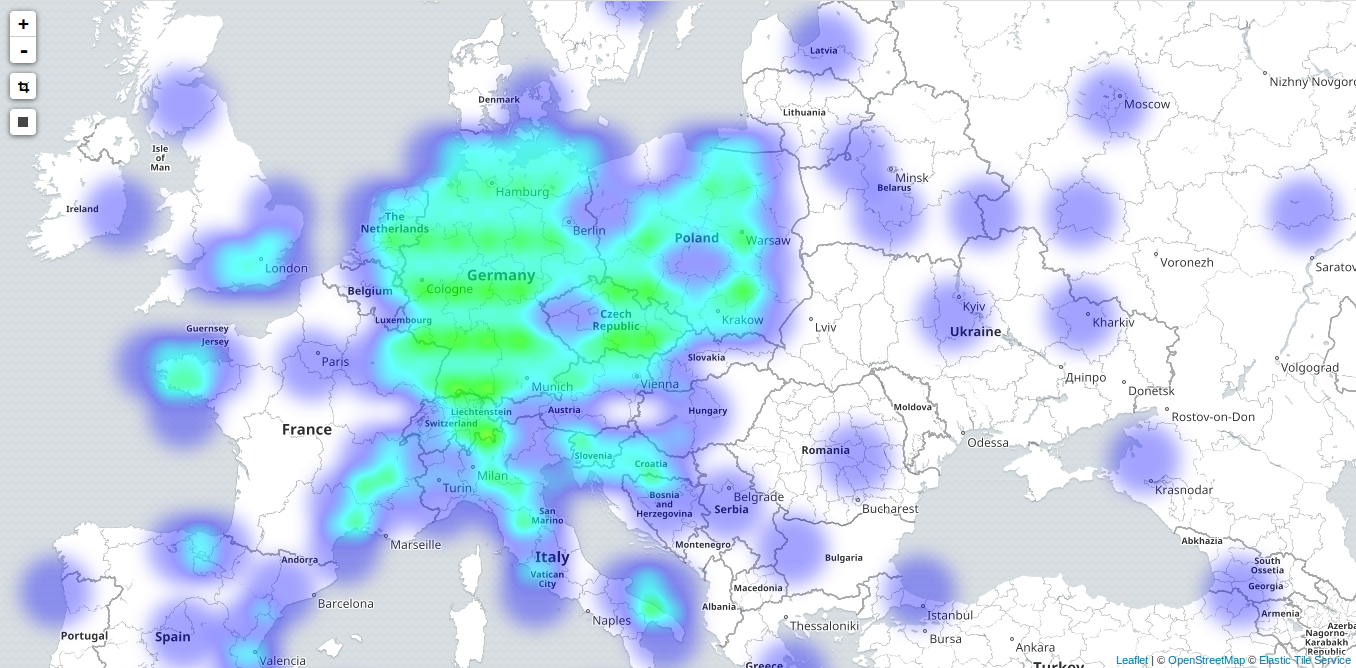
The same period is interesting when looking at an extended section of Central Europe, especially the hotspot-like access in the former Eastern Bloc states or western Russia, or the clear accumulation of accesses around Breton Brest. These are incidentally much higher than from Paris, Rome or Madrid.
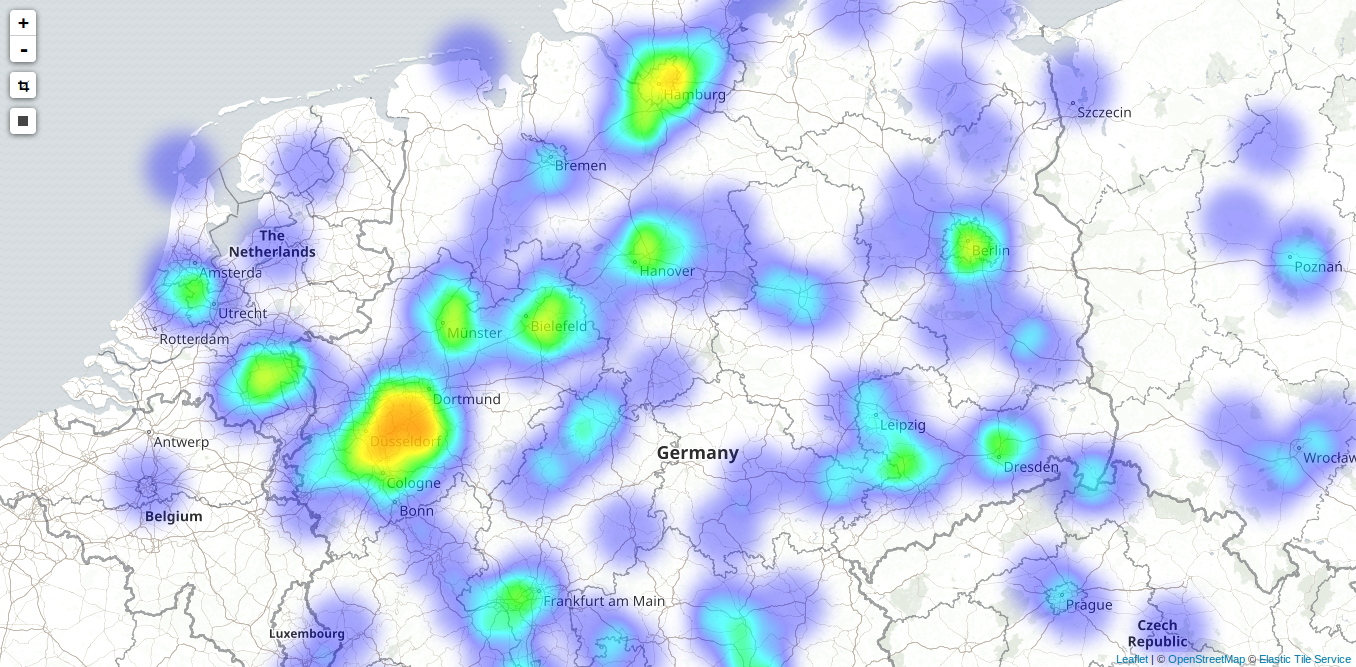
But also the accesses from Germany are not as evenly distributed as one might think based on the maps above. We remain with the 04/05/2016 between 3 PM and 4 PM. The following map shows clear usage focuses in the city triangle of Cologne, Dortmund and – the people of Cologne may forgive us for mentioning it in the same sentence – Düsseldorf, as well as the greater Hamburg area and also the train route towards Berlin following from Münster via Bielefeld, Hanover to Berlin.
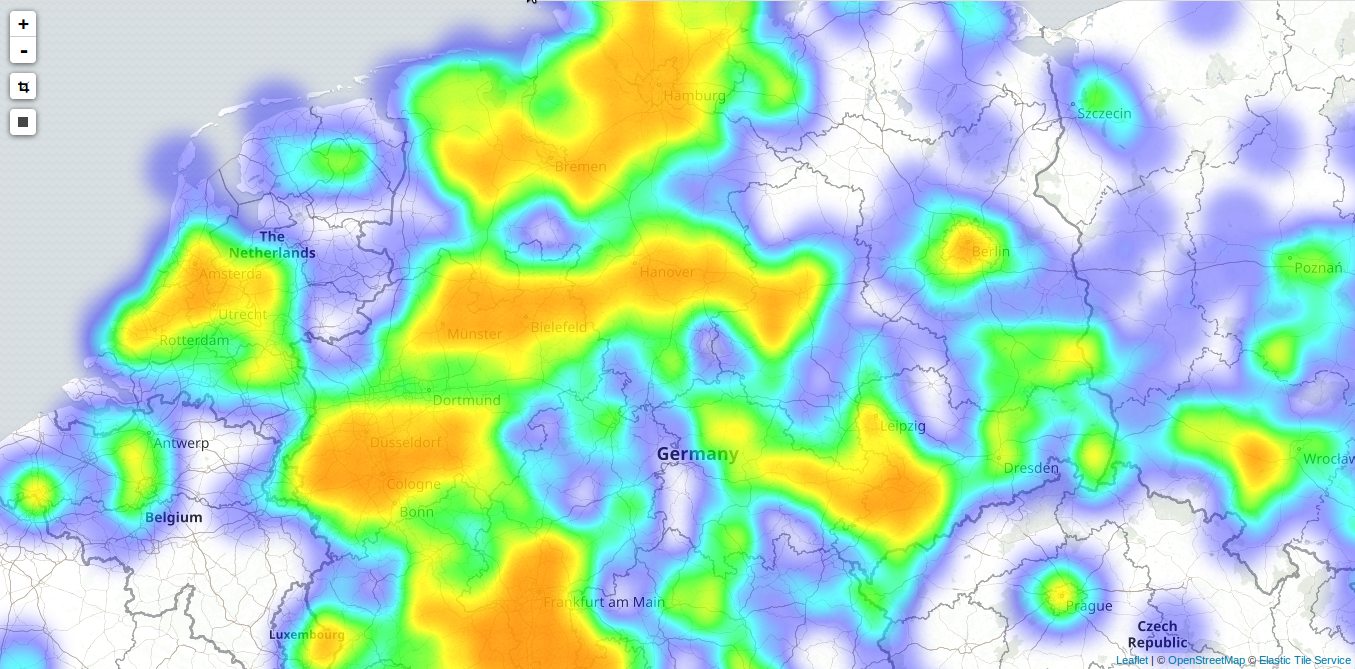
All of this may of course be pure coincidence, as we are only looking at the accesses within a single hour. And indeed, if we extend the observation period to 24 hours between April 4th and April 5th, a completely different picture emerges.
So nice, so good. But what does all this say, except that our service is obviously very popular worldwide and is used by a lot of people – which the access numbers already tell us?
Let’s take a look at the events of the past few days. Last Monday, madmen detonated a bomb in the subway in St. Petersburg. The map on the bottom left shows the accesses to our service between April 4th and 5th.
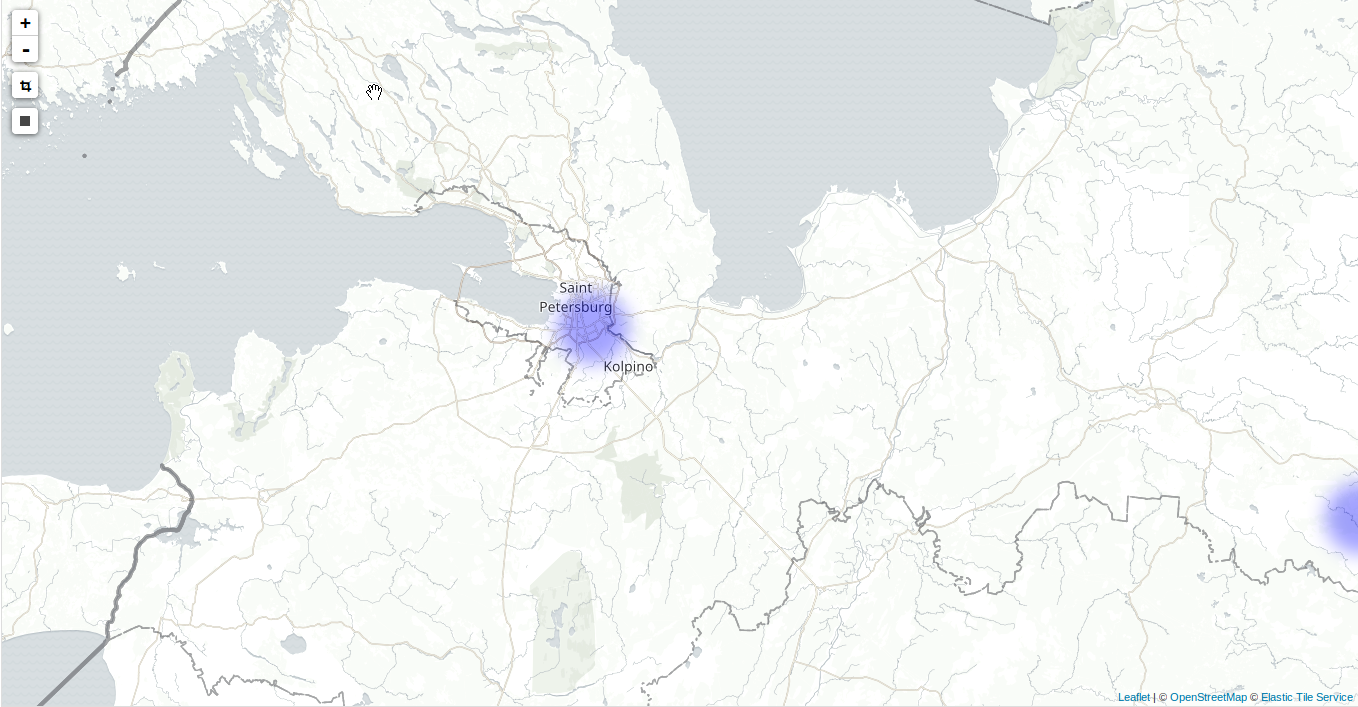
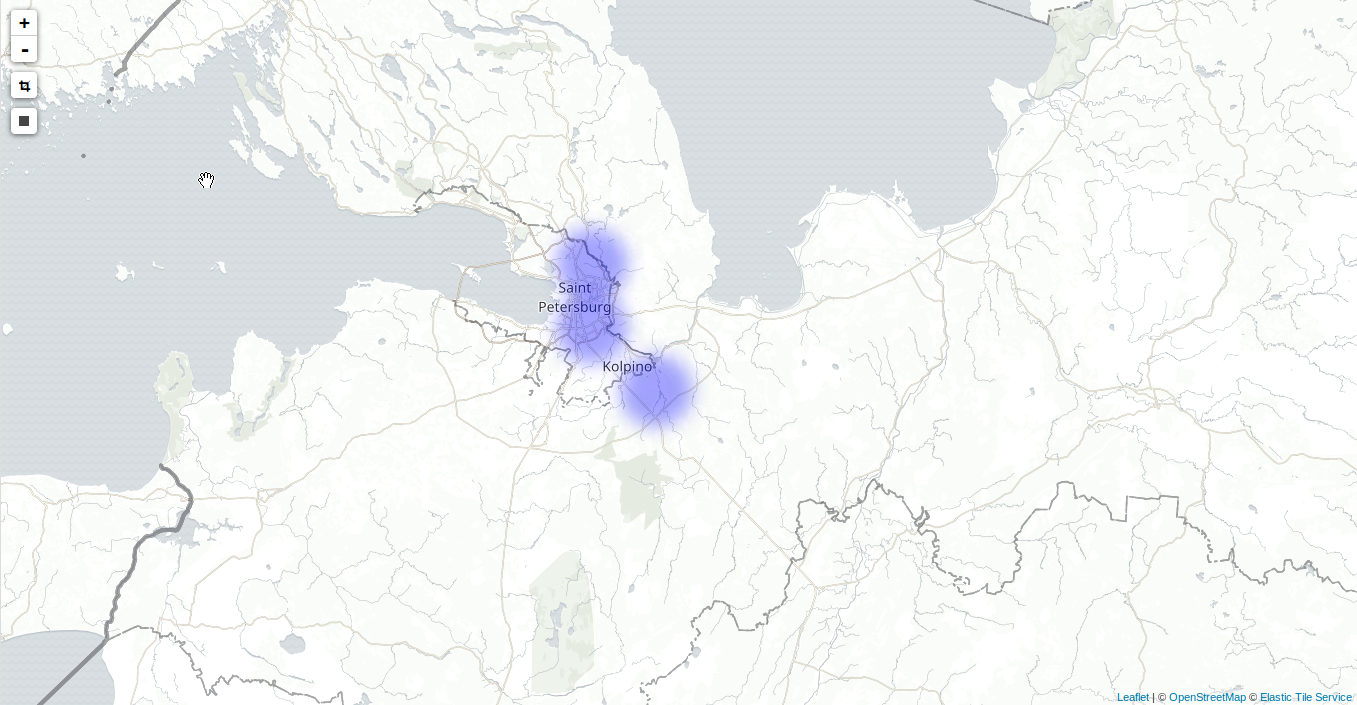
The map to the right of it shows the accesses between the 3rd and 4th – and even if – recognizable by the unchanged coloring – no more accesses are recorded, the accesses take place over a significantly larger area. But this may also be pure coincidence. Let’s take a look at other, more pleasing events, for example the double matchday of the Football Bundesliga on 01/02 as well as on 04/05 April. The map shows the view on Saturday on the left, and on the past Tuesday on the right.
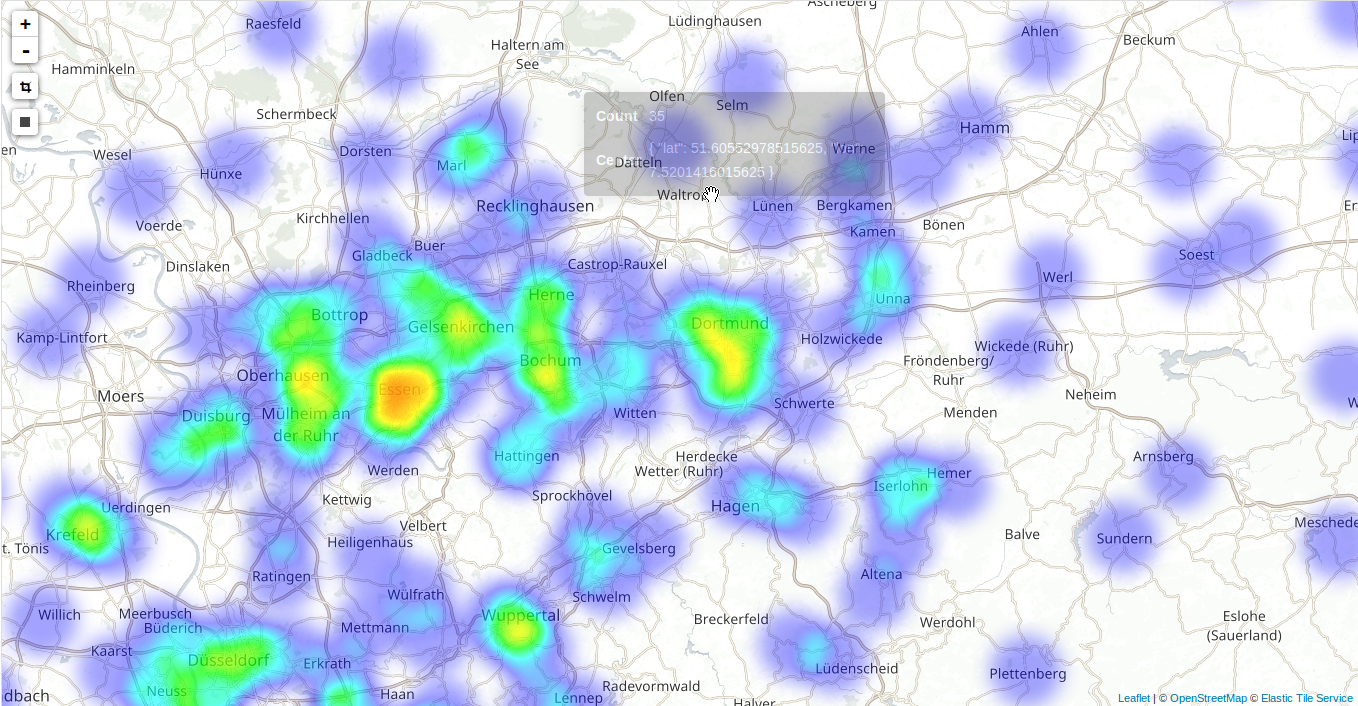
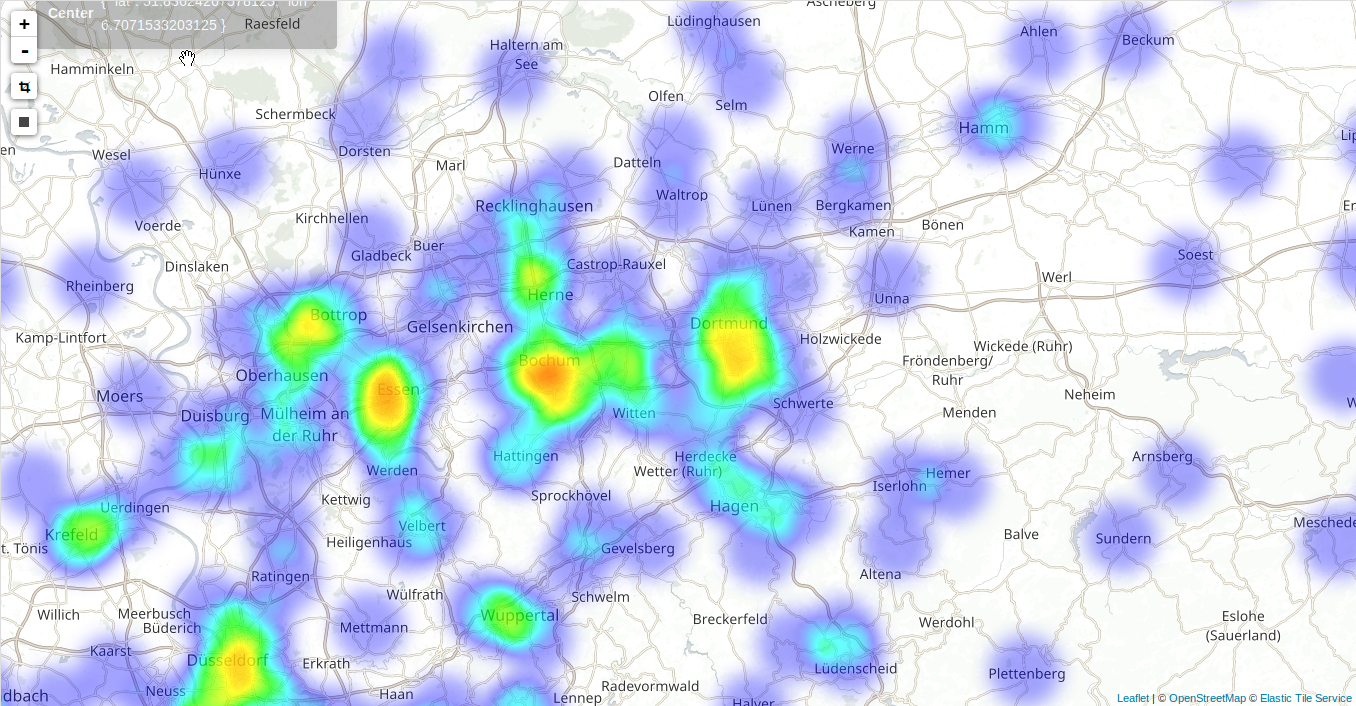
On Saturdays, the Revierderby between Schalke and Dortmund took place in Herne-Ost. Proven by significantly larger access numbers around Gelsenkirchen? In any case, these were not only significantly lower in Gelsenkirchen on Tuesday, when Borussia Dortmund played their home game against Hamburger Sportverein, but also significantly larger around Dortmund.
What does all this say now? Perhaps one can conclude from this that accesses are obviously increasingly taking place from mobile devices. Our service is probably also used by one or the other app. Likewise, the quasi-nationwide high usage in Germany suggests that the service is not only used by city portals like in Hamburg, but also in Germany-wide applications.
In addition, it can be clearly stated that there are still white spots on the famous map. The last map below shows the accesses in 2017.
In addition to the polar regions and missing accesses from the quasi-uninhabited areas of the inner Sahara and the central Himalayas, the overall higher number of accesses from America, West Africa, the Middle East, Australia and a line from India to Japan shows us that our tactic of only pre-caching the Central European area may need to be reconsidered.
We’re sticking with it! Next, our service should finally be available as a premium service with a guarantee of availability.